Sales

Report On Revenue Breakdown in HubSpot Deals

Want instant visibility into how your monthly wins stack up? Build a custom Deal report that breaks down revenue by type, shows your monthly growth in bars, and overlays a cumulative ARR line, perfect for spotting momentum or drop-offs at a glance. Bonus points for scheduling it to land in your team’s inbox every Sunday night so there are no surprises come Monday pipeline reviews. Learn the full setup on the blog.

Sign up for updates on new features, releases, and smart ideas worth knowing.

Thank you! Your submission has been received!
Oops! Something went wrong while submitting the form.

Category

Sales

Type

Hubspot Reports

Tool

HubSpot

All Templates

Out of the box HubSpot’s sales tools are really only focused on helping you close new customers.

If you’re trying to use HubSpot as your source of truth for selling across the customer lifecycle, you'll want to start reporting on your renewal and expansion revenue.

With 70-80% of revenue per customer typically coming after the initial sale it’s a good idea to start by:

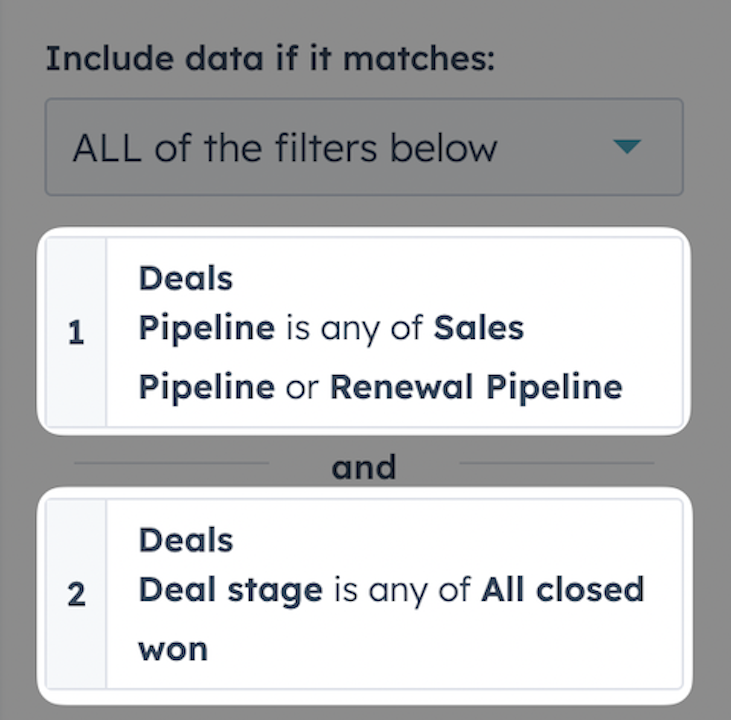
1. Defining the pipeline you will use to manage expansions (either your existing new business pipeline, renewal pipeline, or a dedicated expansion pipeline)

2. Extend the default HubSpot “Deal Type” property to allow more specific definitions of your closed revenue and add pipeline tags to visually identify revenue types in your pipeline.

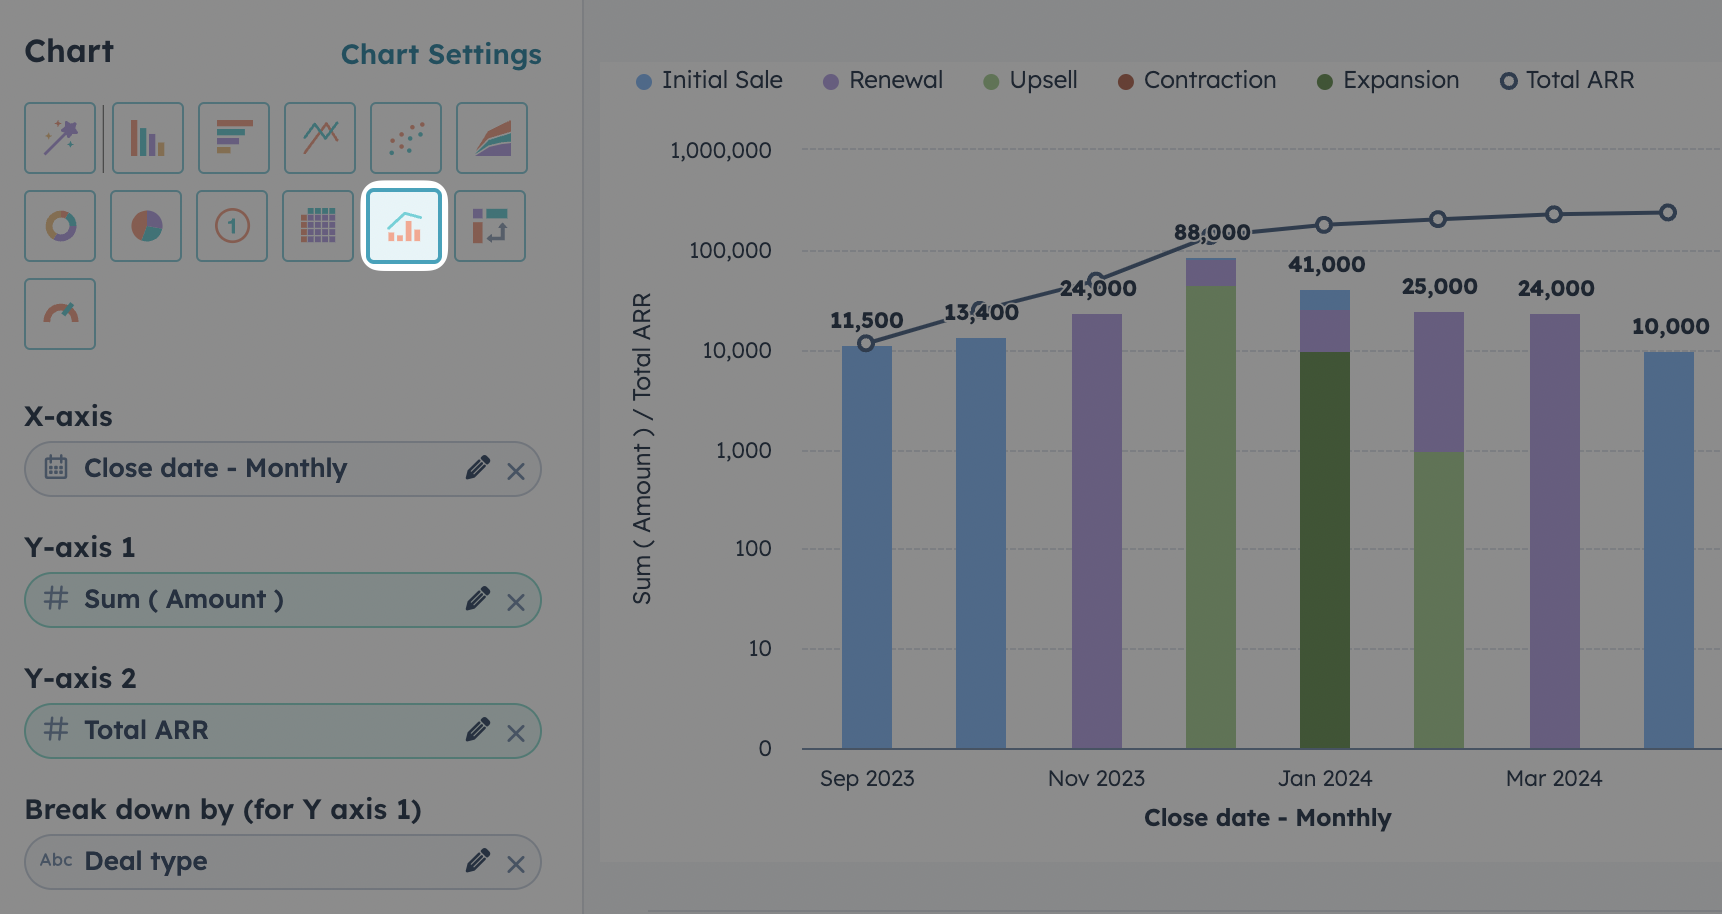
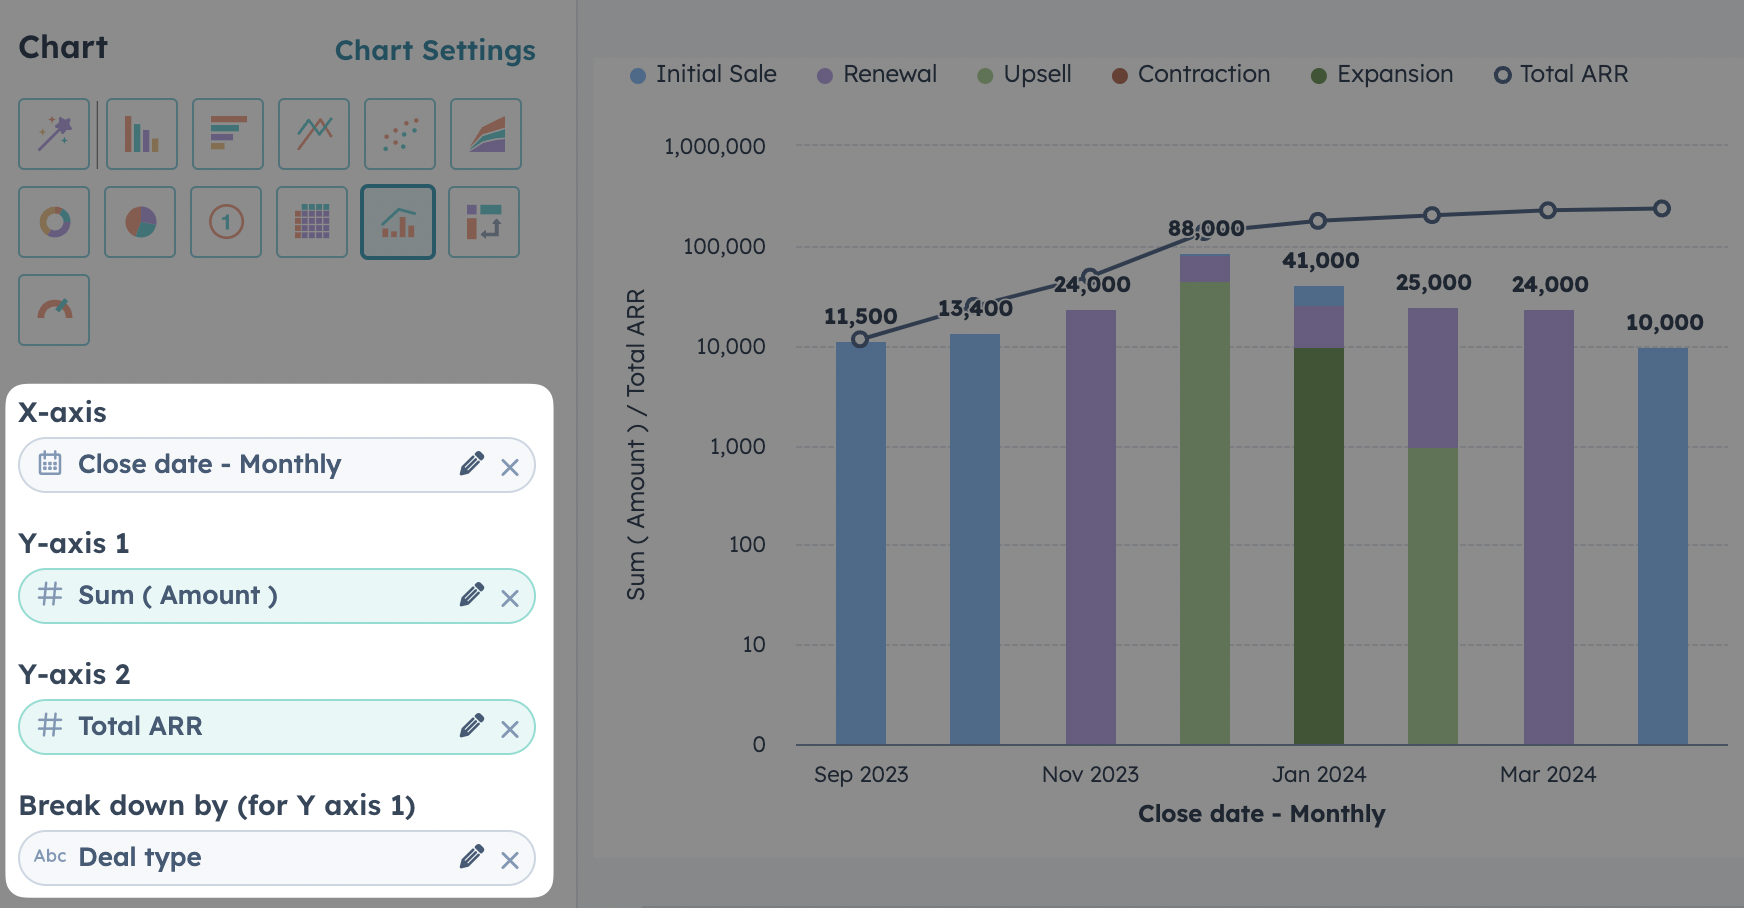
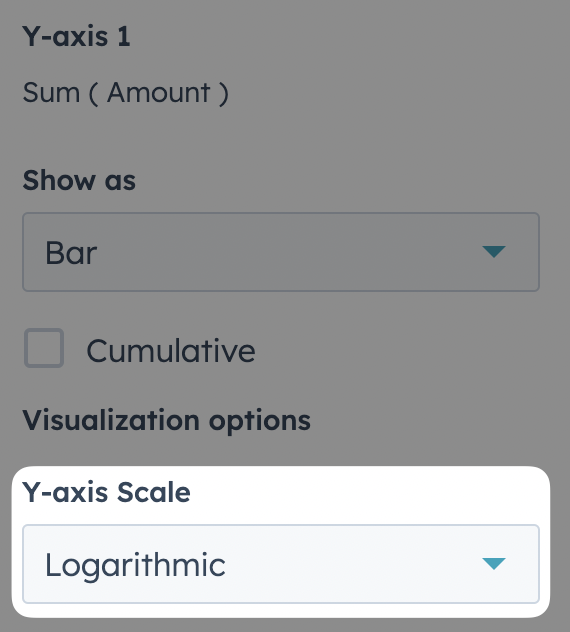
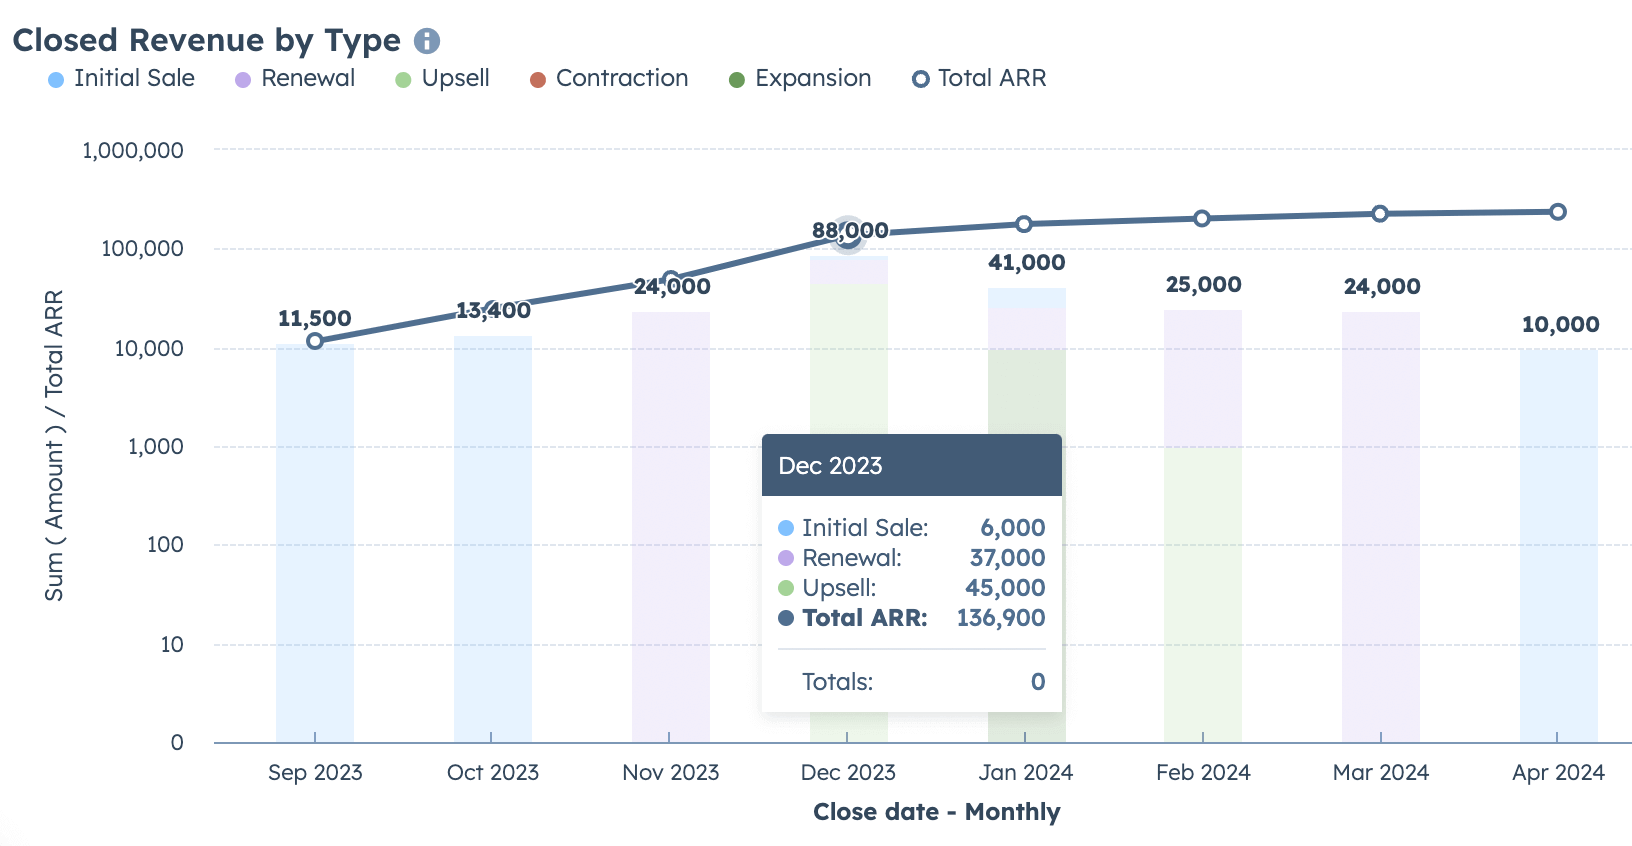
With this basic setup in place we can create an accurate report breaking down our closed revenue 💰

Here’s how it works:

1. Create a custom Deal report and add filters

Filter to the pipeline(s) where customer revenue is being tracked AND only deals that are “Closed Won” across those pipelines.

2. Select our visualisation type

We’ll use the “Combination” chart type to show bars representing our monthly revenue by type and a line for our total cumulative ARR.

3. Select the property values to display:

X-axis: Close Date - Monthly

Y-axis 1: Sum (Amount)

Y-axis 2: Sum (Amount) - Rename this to “Total ARR”

Break down by: "Deal Type"

4. Configure chart settings for Y-axis 1

Show this as “Bars” and set the Y-axis scale to “Logarithmic” to avoid the graph looking funky with a lot of whitespace as your total revenue becomes significantly higher than each single month over time.

5. Configure chart settings for Y-axis 2

Set this to show a “Line” and importantly check the box to make this field “Cumulative” so we are displaying total ARR instead of only the revenue for a single month.

Getting visibility into how your revenue is distributed each month can help your team focus on what’s most impactful to move the business forward.

Bonus: Don’t forget you can automatically send an email with your report to your team on a schedule (I prefer late Sunday night) so there’s no excuse for anyone not to have seen the numbers before your pipeline reviews.